On this page you’ll find hand-picked stats about:
- The Cyber Security Landscape in 2022
- The Cost of Cyber Security Incidents
- Strategic Planning
- The Essential 8
- Cyber Security in the Board Room
- Cyber Security Protection Trends
- Lots more
So without further ado, let’s see the stats!
Get more insights like these
Receive advice from our industry-leading cyber security experts.
Cyber Security Incident Statistics
The State of the Cyber Security Landscape
Global cyberattacks increased by 38% in 2022, compared to 2021.4
83% of organisations had more than one data breach in 2022.2
82% of all breaches involved ‘the human element’ (the use of stolen credentials,
phishing, misuse or human error) in 2022.
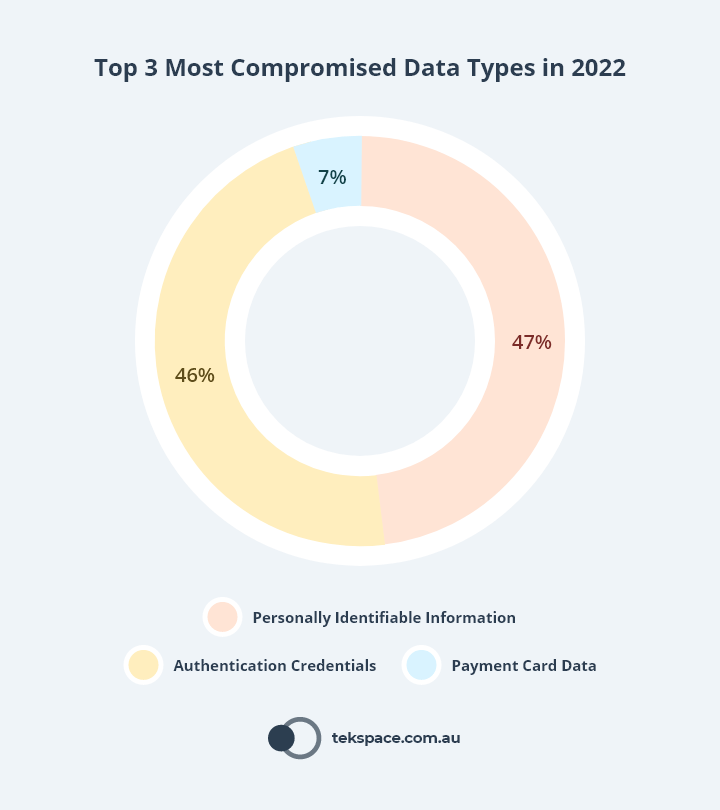
5Approximately 47% of all cyber security incidents involved Personally Identifiable Information (PII), 46% of involved Authentication Credentials and 7% involved Payment Card Data.5
60% of data breaches lead to increases in prices passed on to customers in 2022.2
The median number of compromised records for an insider breach was 375,000, more than 10x the median number of compromised records for an outsider breach (30,000).5
84% of all cyber security incidents involved servers in 2022 (56% web application servers, and 28% mail servers).5
19% of all cyber security incidents in 2022 were caused by supply chain attacks.2
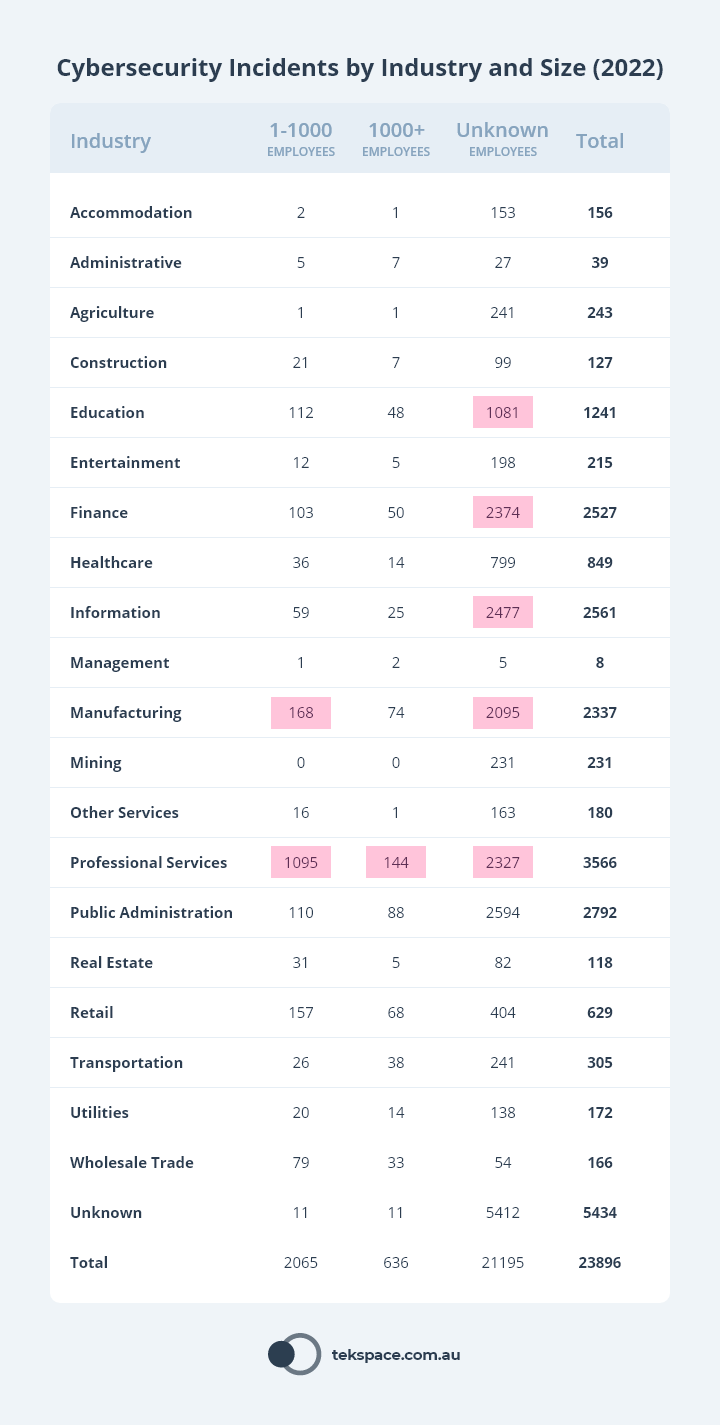
The top 3 most attacked industries were Education/Research, Government/Military and Healthcare in 2022.4
11% of all cyber security incidents were caused by Ransomware attacks in 2022.2
40% of Ransomware incidents involved the use of Desktop sharing software and 35% involved the use of Email in 2022.5
Total number of Ransomware attacks increased by 13% in 2022, a rise as big as the last five years combined.5
13% to 24% of all cyber security incidents were caused by IT failure (computer system disruption, process failure, source code errors etc.) in 2022.2 5
The average time to identify and contain a data breach was 277 days in 2022.2
The Cost of Cyber Security Incidents
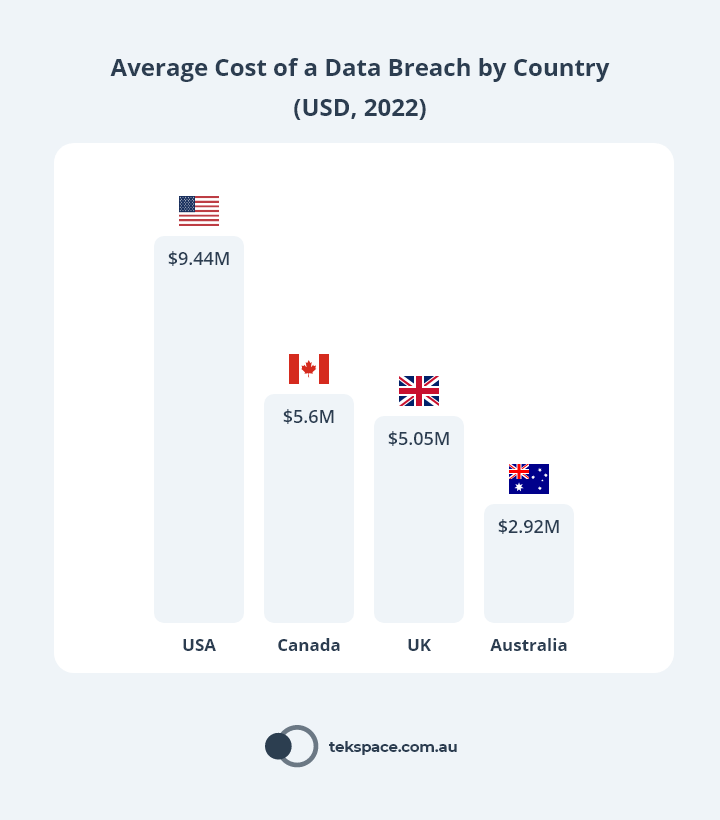
The global average cost of a data breach was $4.35M USD (approx. $6.3M AUD) in 2022.2
The average cost of a data breach in the United States was $9.44M USD (approx. $13.6M AUD) in 2022.2
The average cost of a data breach in the United Kingdom was $5.05M USD (approx. $7.3M AUD) in 2022.2
The global average cost of a successful phishing attack was $4.91M USD (approx.$7.1M AUD) in 2022.2
The average cost of a data breach in Australia was $2.92M USD (approx. $4.2M AUD) in 2022.2
The average cost of a data breach in Canada was $5.64M USD (approx. $8.1M AUD) in 2022.2
The global average cost of a successful ransomware attack was $4.54M USD (approx. $6.6M AUD) in 2022.2
The global average cost of a data breach for organisations with fully deployed AI and automation was $1.3M USD (approx. $1.9M AUD) in 2022.2
Cyber Security Strategy and Governance Statistics
Strategic Planning
72% of Australian entities have a cyber security strategy (as of FY2022), up from 61% in 2021.1
82% of Australian entities address disruptions due to cyber security incidents as part of their business continuity planning (as of FY2022).1
79% of Australian entities have an Incident Response Plan, but only 49% of them test this plan at least every 2 years (as of FY2022).1
51% of Australian entities [that encountered a cyber security incident] reported cyber security incidents to the ACSC (as of FY2022).1
94% of Australian entities have identified the systems and data most essential to their business (as of FY2022).1
25% of boards discussed cyber security matters once per month, 21% discussed it once every 2 to 3 weeks, 15% discussed it once per week, and 38% discussed cyber security less frequently in 2022.3
255 cyber security incidents were reported to the ACSC in FY2022.1
51% of cyber security professionals think their companies face extreme risks due to an insufficient cybersecurity workforce.6
Cyber Security at the Board of Directors
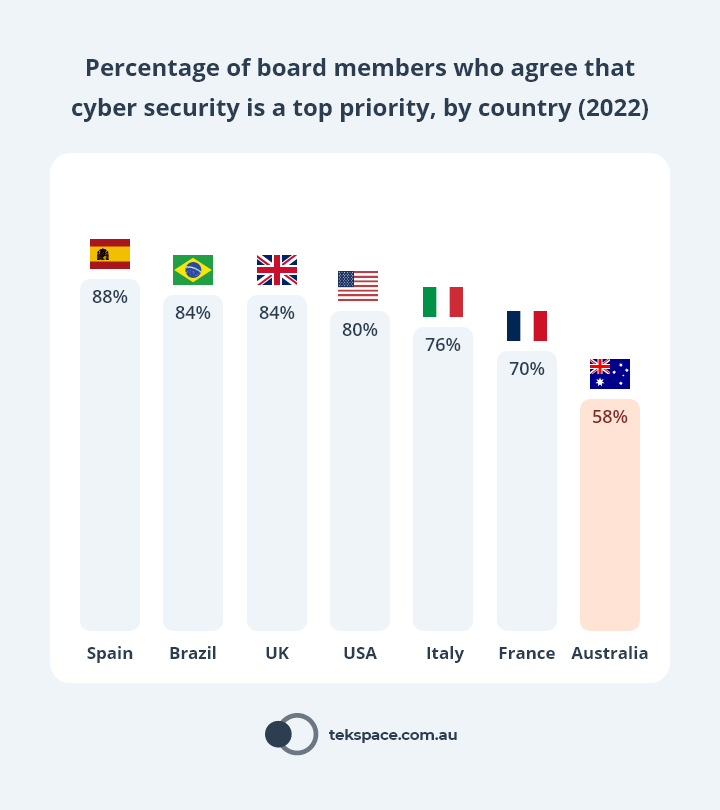
Only 58% of Australian board members agree that cyber security is a priority for their board – the lowest of any region globally.3
CISO communication skills are seen as most valuable for boards in Japan and Australia than anywhere else in the world.3
In 2022, 68% of Australian CISOs agreed that their organisation is at risk of a material cyber attack in 2023.3
Only 70% of Australian boards had CISO representation in 2022 – the lowest of any region globally.3
52% of Australian board members agree that their organisation is at risk of a material cyber attack in 2023.3
Board members and CISOs agree that the top three risks for 2023 are Ransomware Attacks, Email Frau and Cloud Account Compromise (Microsoft 365, Google Workspace or Other)3
Implementation of the Essential Eight
11% of Australian entities reached
Essential Eight Maturity Level 2 (as of FY2022).
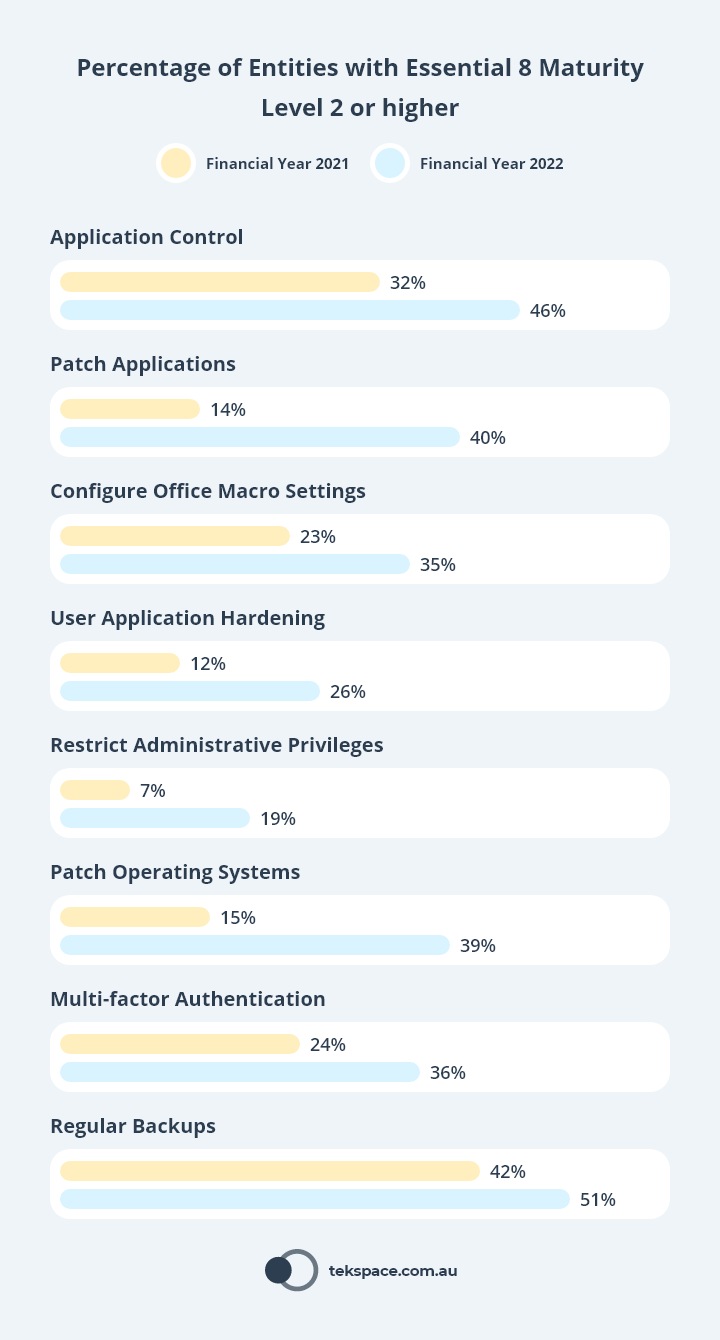
40% of Australian entities have implemented Patch Applications to Essential Eight Maturity Level 2 or higher as of FY2022, up from 14% in FY2021.1
26% of Australian entities have implemented User Application Hardening to Essential Eight Maturity Level 2 or higher as of FY2022, up from 12% in FY2021.1
39% of Australian entities have implemented Patch Operating Systems to Essential Eight Maturity Level 2 or higher as of FY2022, up from 15% in FY2021.1
51% of Australian entities have implemented Regular Backups to Essential Eight Maturity Level 2 or higher as of FY2022, up from 42% in FY2021.1
46% of Australian entities have implemented
Application Control to Essential Eight Maturity Level 2 or higher as of FY2022, up from 32% in FY2021.
135% of Australian entities have implemented Configure Microsoft Office Macro Settings to Essential Eight Maturity Level 2 or higher as of FY2022, up from 23% in FY2021.1
19% of Australian entities have implemented Restrict Administrative Privileges to Essential Eight Maturity Level 2 or higher as of FY2022, up from 7% in FY2021.1
36% of Australian entities have implemented Multi-factor Authentication to Essential Eight Maturity Level 2 or higher as of FY2022, up from 24% in FY2021.1
Cyber Security Protection Statistics
Zero Trust
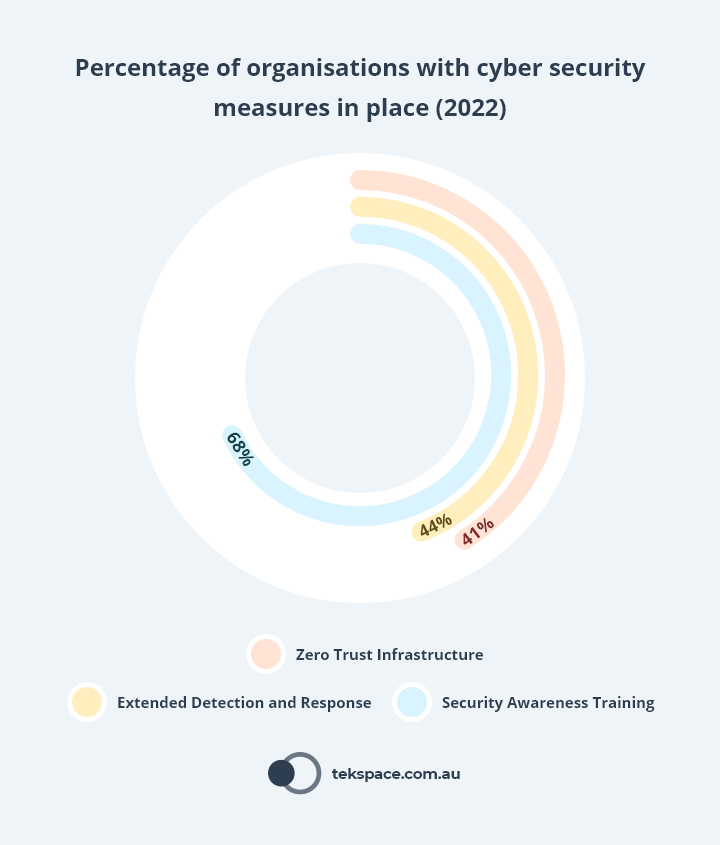
59% of organisations did not have a ‘zero trust’ IT architecture in 2022.2
The global Zero Trust market was approx. $27.4B USD (approx. $40B AUD) in 2022, and is expected to grow to $60.7B USD (approx. $87.8B AUD) by 2027.6
79% of organisations in financial services, manufacturing, technology, energy, transportation, communication, healthcare, education and the public sector did not have a
‘zero trust’ IT architecture in 2022.
2
Extended Detection and Response (XDR)
XDR decreases the average cost of a data breach by 9.2% ($200k USD / $290k AUD).2
On average, XDR shortened the lifecycle of a breach by 29 days in 2022.2
Security Awareness Training
The median transaction size resulting from Business Email Compromise attacks was $60,000 USD (approx. $87,000 AUD) in 2022.5
Approximately 814,000 phishing websites were created in 2022.7
34% of Australian entities provided privileged user training at least annually (as of FY2022).1
43% of Business Email Compromise attacks involved the use of stolen credentials in 2022.5
Google Sites (sites.google.com) and Google Docs (docs.google.com) were the 7th and 8th most used phishing hosts in 2022.7
The top four TLDs used to host phishing in 2022 were .com, .top, .org and .net.7
Other
61.3% of Australian entities use
recommended email security measures, Sender Policy Framework (SPF) and Domain-based Message Authentication Reporting and Conformance (DMARC).
128.6% of Australian entities use web server encryption measures, Hypertext Transfer Protocol Security (HTTPS) and HTTP Strict Transport Security (HSTS).1
41.6% of Australian entities use recommended email encryption measures, Transport Layer Security (TLS) and Mail Transfer Agency Strict Transport Security (MTA-STS).1
Get more insights like these
Receive advice from our industry-leading cyber security experts.
Table of References


